Electricity Inverter Monitoring
This post is a companion to my inverter monitoring project.
Electricity inverter products typically come with a mobile app to visualize your production and consumption data. I wanted to be able to retrieve this telemetry directly from my inverter which is shipped with a separate stick logger. When configured for the local WiFi network, the logger is responsible for sending telemetry to a proprietary web service. If the stick logger is not supplied, there are options to interface directly with the inverter hardware like this product. Since my inverter came with the logger device and because I do occasionally use the mobile app, I wanted to be able to tap additional data off the logger on my local network to get more fields than I am able to see on either the app or the proprietary web interface.
Having found a binary protocol translator for my stick logger, I went to work building an application around this for the purposes of visualizing the data. I also wanted to send some MQTT messages for control of switches for which I created a companion project to control some ESP32 devices. I wanted to be able to create a crude measure of solar production capability by fetching cloud cover data for my location, and in addition to this I created a synthetic metric that indicates the proximity to noon for the given time of the year. I haven’t found this particularly indicative of solar production capacity however.
For some remote monitoring, I built two physical dashboards that receive MQTT messages and display them on an LCD on one and an LED matrix on the other. You can find the code for these projects here. Here are some pictures of these dashboards in action.
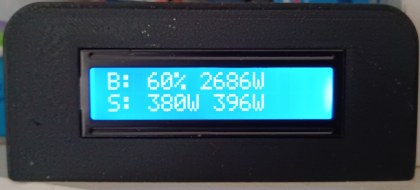
This dashboard shows “B” to represent battery charge percentage along with the last measured load on the batteries. A negative value indicates charge and a positive value indicates discharge. The bottom row shows “S” to indicate the power delivered by each string of solar panels. You can find the Thingiverse porject for this enclosure here.
This next LED matrix dashboard still needs an enclosure and a translucent face plate. It cycles between battery state of charge and load on the batteries.
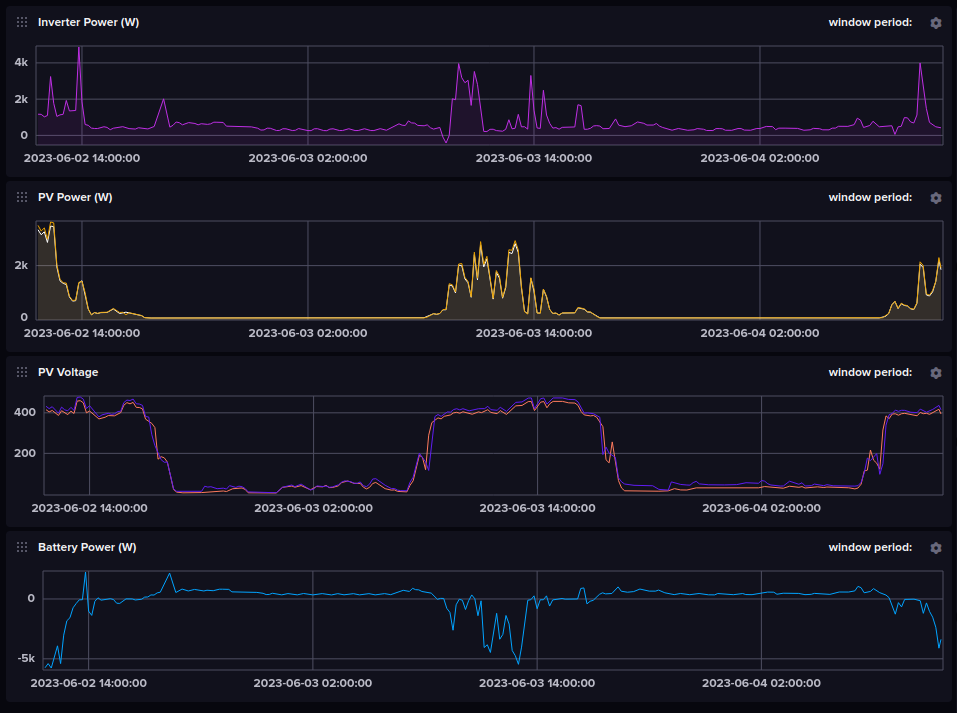
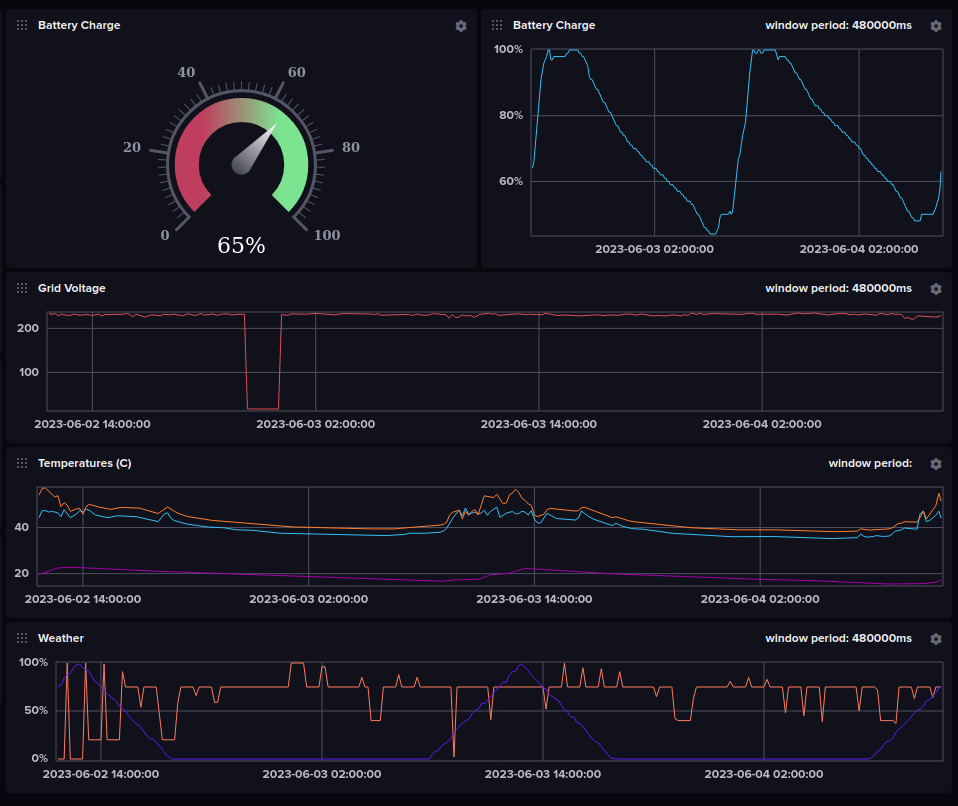
The template for this InfluxDB dashboard is located here.